This report seems to be a natural follow up to yesterday's carbon cult insanity-
![]()
Select comments
Which is the group of nutters? The Greeda followers or the questioners? You know it's the Greeda followers!
Roy Spencer Phd- Climatologist/Former NASA scientist
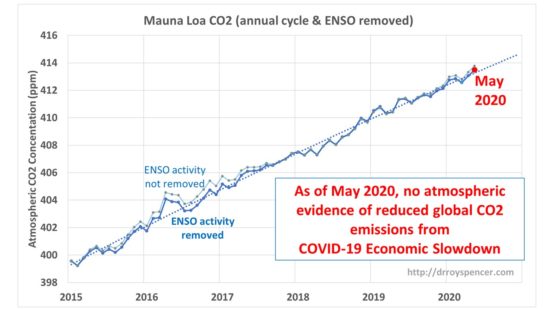
The Mauna Loa atmospheric CO2 concentration data continue to show no reduction in the rate of rise due to the recent global economic slowdown. This demonstrates how difficult it is to reduce global CO2 emissions without causing a major disruption to the global economy and exacerbation of poverty.
After removal of the strong seasonal cycle in Mauna Loa CO2 data, and a first order estimate of the CO2 influence of El Nino and La Nina activity (ENSO), the May 2020 update shows no indication of a reduction in the rate of rise in the last few months, when the reduction in economic activity should have shown up.

I had previously explained why the slowdown would likely not be large enough to affect measured atmospheric CO2 levels compared to natural variations in global sources and sinks of CO2. I calculated that the Energy Information Administration-estimated 11% reductions in CO2 emissions during 2020 would have to be four times larger to stop the rise of atmospheric CO2 over 2019 values (assuming no substantial natural variations in CO2 sources and sinks).
Select comments
As I showed on WUWT a week or two ago, the CO2 measurements are at best +/- 1 ppm which places a severe impediment on inferring rates and amounts of change and the allocation of their causes.
I am with Roy. I consider the changes in CO2 due to lockdowns are likely to be too small to be detected with acceptable confidence.
See what happens when one actually does the science of getting the raw data and analysing it, instead of listening to propaganda informed by propaganda. Geoff S
The Keeling Curve
This shift between the fall and winter months to the spring and summer results in the sawtooth pattern known as the Keeling Curve measurement of atmospheric CO2 such that every year there is a decline in CO2 during months of terrestrial plant photosynthesis and an increase in CO2 in months without large amounts of photosynthesis and with significant decomposition.
In general, researchers found strong seasonal CO2 fluctuations throughout the Northern Hemisphere and weaker fluctuations near the equator and in the Southern Hemisphere
The station at Barrow, Alaska (71° N latitude), for example, experiences enormous swings in seasonal CO2. In fact, at this site, the daily 400 part-per-million (ppm) benchmark was passed for brief periods starting in 2006
At the opposite end of the spectrum, at the South Pole (90°S latitude) and other sites in the Southern Hemisphere, there is hardly any seasonal variability.
These latitudinal differences in fluctuation are the result of photosynthetic activity by plants. As plants begin to photosynthesize in the spring and summer, they consume CO2 from the atmosphere and eventually use it as a carbon source for growth and reproduction. This causes the decrease in CO2 levels that begins every year in May.
Because photosynthetic activity is the cause of seasonal CO2 swings, regions with more plants will experience larger fluctuations.


